Chapter 10: Generate Report
The Generate Report feature in Yield-Pro provides a comprehensive analysis of the wafering process. It highlights critical data points that support improved cutting performance and optimized material utilization. This functionality enables close monitoring of material behavior, detailed tracking of defect statistics across crystal layers, and more accurate planning for future operations.
Look at this video to see how to generate a report (starting at 3:50):
How to Generate Report ?
Important
Report generation is currently available only for cylindrically shaped crystals.
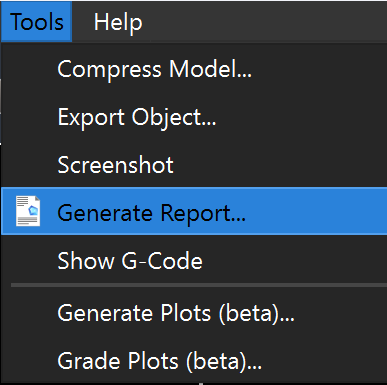
You need to load a model and then press the Generate Report... option in the Tools menu.
You will have several options to choose from:
Report Type: Select the type of report you want to generate.
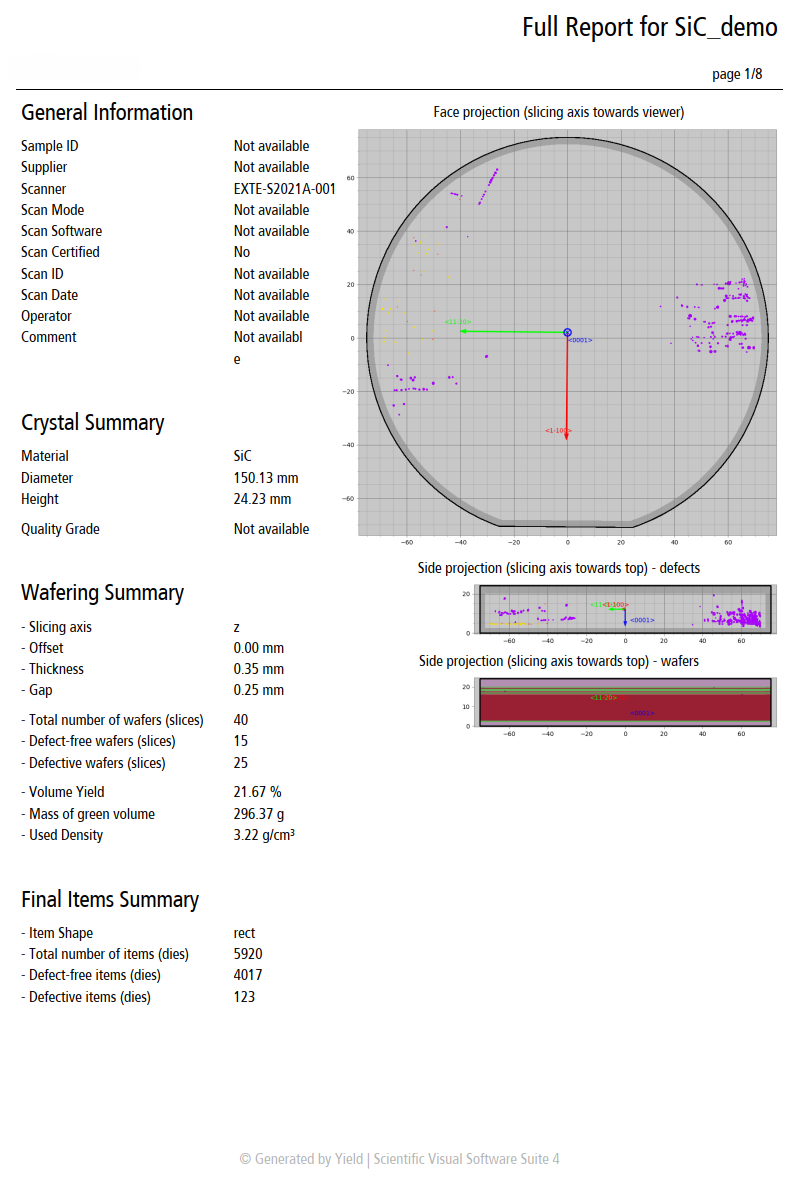
General: Provides an overview of the scan (only the first page).
Wafers: Focuses on detailed wafering parameters (first page and binare wafering grade).
File path: Specify the directory where the report will be saved.
Wafer thickness [mm]: Specify the thickness of the wafers.
Structure of the Wafer Report
General Information
This section covers fundamental details of the scan, including, but not limited to:
Sample ID.
Supplier and scanner specifications.
Crystal material type.
Crystal Summary
Key crystal dimensions such as diameter and height.
Wafering summary, including slicing axis, total wafer count, number of defect-free wafers, and defect statistics.
Quality grade assessment and wafer yield percentages.
Wafering Summary
This section provides an overview of wafering parameters, including:
Wafer diameter, thickness, and spacing between wafers.
Total number of wafers and the count of defect-free wafers.
Size and gap specifications
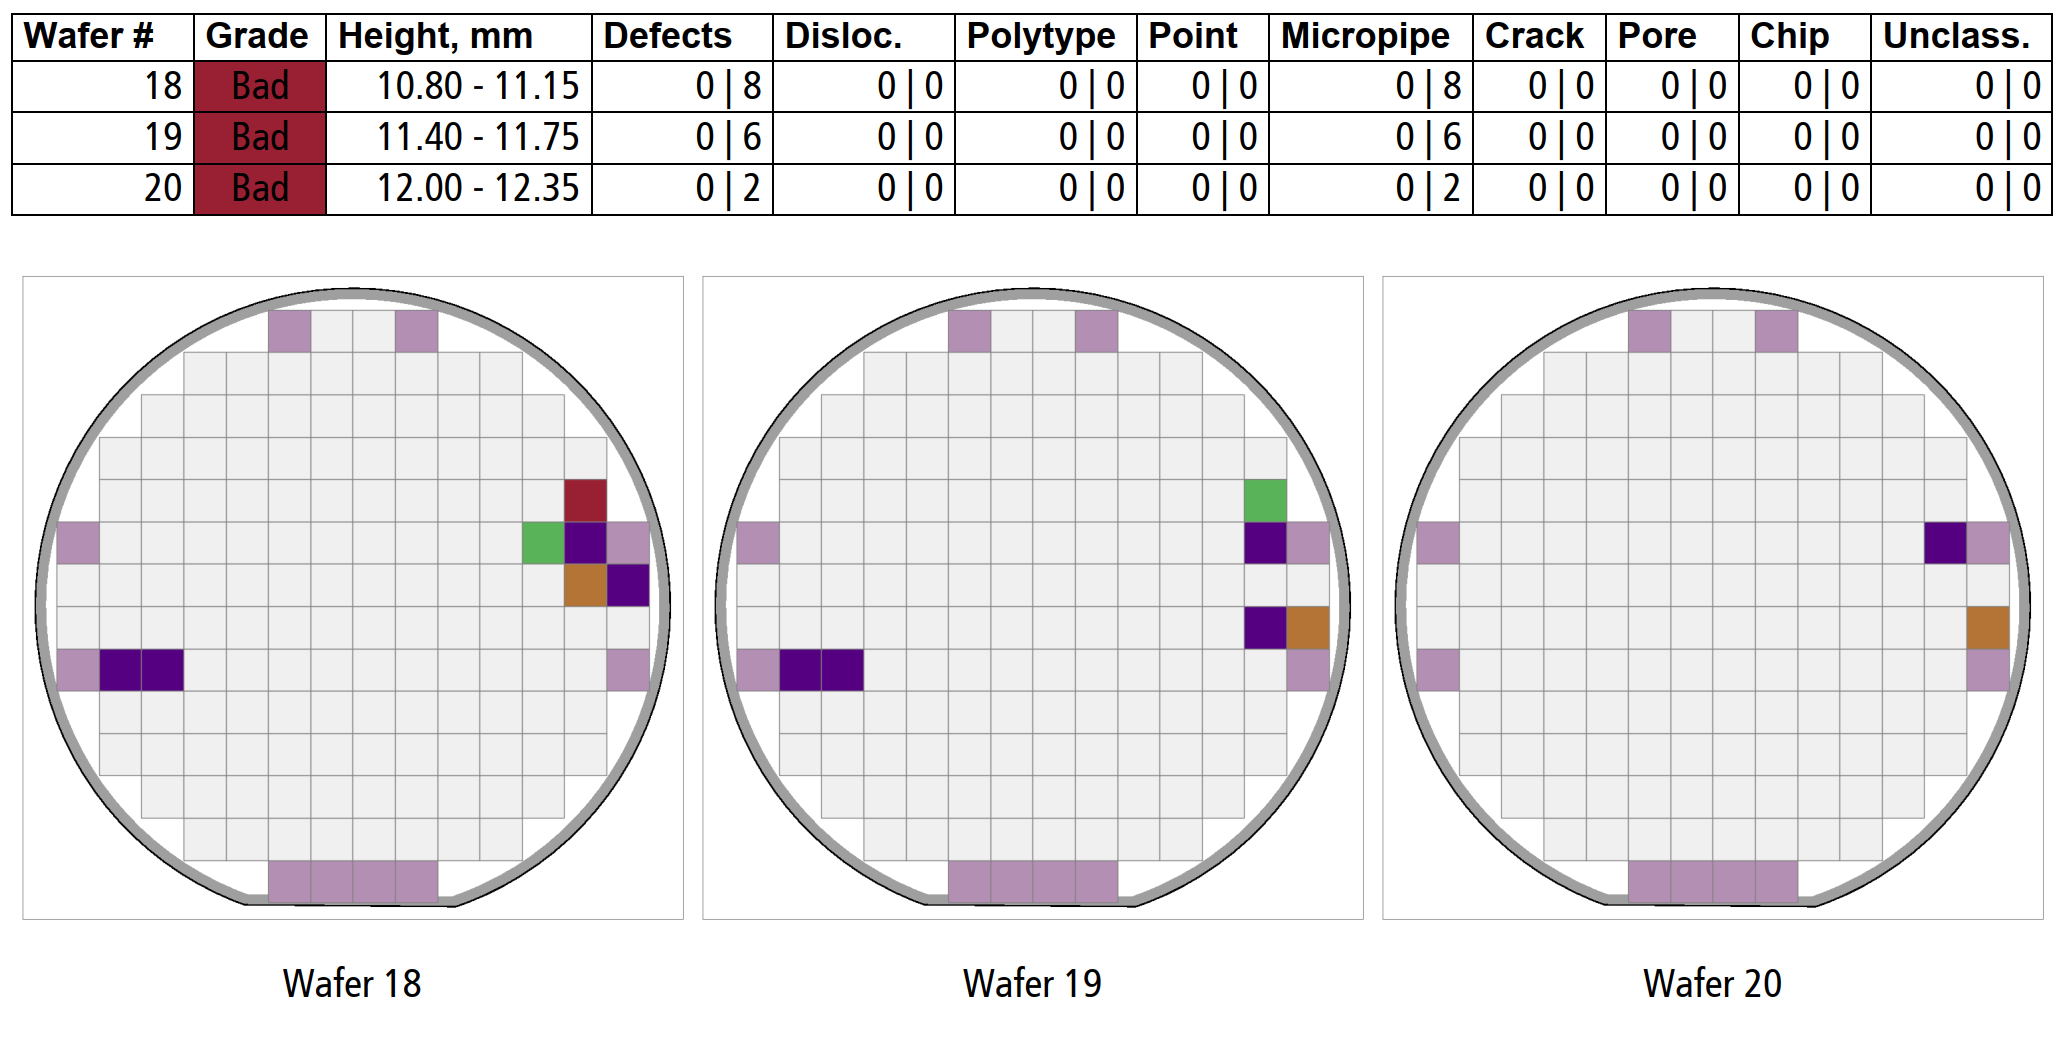
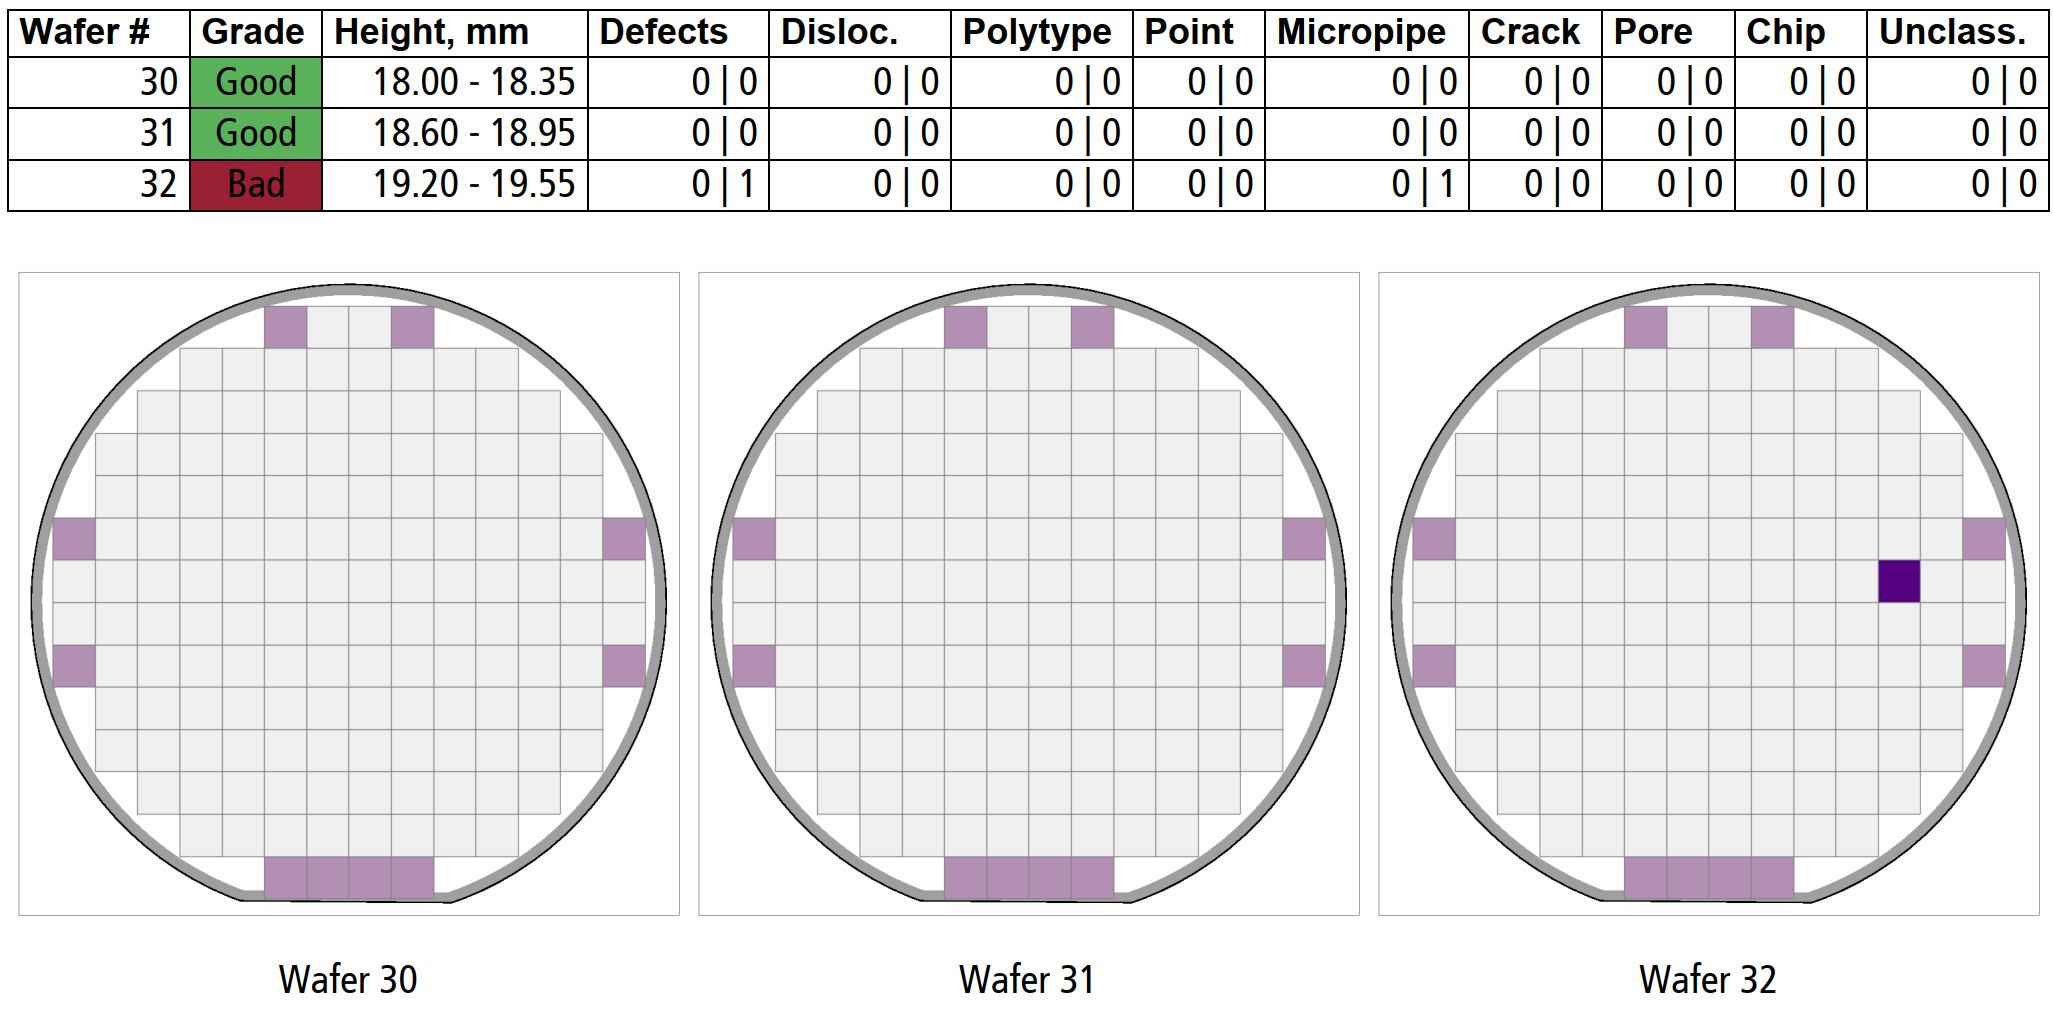
Cutting Plan – Individual Wafers
This subsection contains a detailed table listing attributes for each wafer, such as:
Wafer number.
Wafer height.
Number of defects
Defects categorized by type (e.g., micropipes, polytypes, chips).
Grade assigned based on defect analysis.
Visualization
A color-coded chart is also included to visually represent wafering results. These visualizations highlight regions with varying probabilities of defects, providing insight into overall wafer quality.
Example
First page
Good Binary Wafering Grade
Bad Binary Wafering Grade