Modules Tabs
Modules tabs can be shown/hidden through menu and pined/unpined either on west or est side of the main window.
Demo version of Yield comes with three default modules.

Crystal Module
Crystal module is divided in three sections:
Crystal information
ID: unique identifier of the 3D model
Diameter: of the piece if it can be assimilated to cylinder
Height: of the piece
Material: of the piece
Comment: any comment
etc.
Auxiliary elements
Visibility and color of the auxiliary element in all Views can be set here
Scan settings information
Any scan settings metadata adding some physical context to numerical data
Note
Auxiliary elements id usually use a standard over two digit.
Note
Scan settings are disabled with demo models.
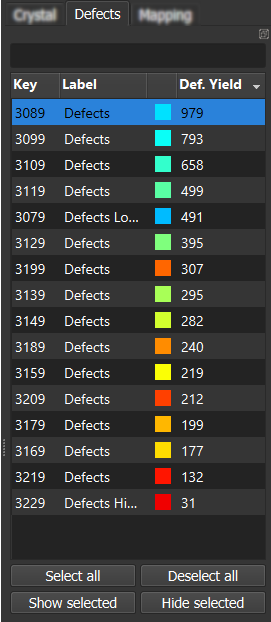
Defects Module
Defect module is composed of a table and action button. The table lists the individual defects displaying key, label, color and any predefined metrics considered as an integrated value of all smaller items.
Visibility and color of the defect elements in all Views can be set here.
Note
Defects acts as clusters and are composed of at least one smaller items (i.e. points, meshes, etc). Individual defects are usually either spots (defined by morphology) or group of similar items (i.e group by intensities)
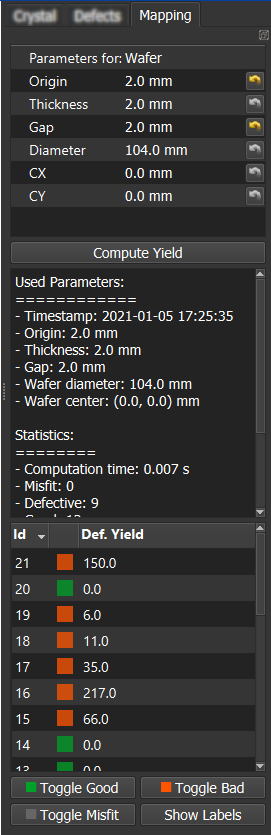
Mapping Module
The purpose of this module is to map items into the 3D crystal shape optimizing the output yield. Actually the first available mapping algorithm is dedicated to wafering: cutting wafers (~1-2 mm) out off grown-cylinder.
Mapping module is composed of two sections and some action buttons:
Mapping parameters
Mode: only wafer available. Assume wafering is perfectly vertical (aligned to z axis) and centered on (cx, cy)
Origin: z-level of the first wafer
Thickness: of desired wafers
Gap: between wafers induced by cutting wire
Center X (CX): center x-coordinate for wafering (usually 0)
Center Y (CY): center y-coordinate for wafering (usually 0)
Yield computation and results
Once parameter set, computation can be done pressing “Compute Yield”. It will take several second (see below note). Once computation ends, results are displayed below. First a readonly text area with statistics that can be copy paste for records and then the individual found items with default coloration such that:
Green for good material
Red for bad material
Gray for misfit material (meaning the item is overflowing the shape)
Visibility and color of the elements in Mapping view can be set here.
Note
Advanced mapping algorithm (coming soon) are definitely more time consuming because mainly based on solving the backpack problem which is NP-hard.